Lesson 1: understand the investment approach, decision rules and risk. Explanations start from your current level, with examples you can discuss.
An original programme by Igor Maslov
Investing Without the Rush
Make room for life.
Entirely one-to-one

Travel, be with the people you love and keep doing work that matters to you. Learn a clear investment process from the beginning, build a written plan and organise scheduled reviews. Every lesson, practical session and assignment review is personal: just you and Igor.
1 monthInvesting Without the Rush
4 meetings10 hours
2 lessons2 practice sessions
+3 monthsYour personal chat

Your teacher
Igor Maslov
Make room for life.
Time for what you love.
Investments require attention. Clear rules help you know what to check and when to return to everyday life.

Discover somewhere new
Choose tomorrow’s route over coffee. Your investment plan should leave room for your own plans.

Be there for each other
An unhurried conversation, a shared meal and the small pleasures of an ordinary day.
Investing Without the Rush
One month. A plan you understand.
Two substantial live lessons of three hours each and two separate homework reviews of two hours each: four private meetings, ten hours altogether. Complete two assignments between meetings; independent work is additional to the live hours.
Assignment 1 and its review: put the ideas into your own words. We examine your reasoning, questions and mistakes, and revisit anything unclear.
Lesson 2: apply the approach to your chosen market, define conditions for decisions and plan your investment reviews.
Final assignment and review: assemble your written plan, explain your rules and discuss the next steps. Agree the dates and market before enrolling.
Investing Without the Rush
Your plan brings together a goal, time horizon, chosen market, risk rules, reasons to act or wait, and a review schedule. Access to instruments depends on your country and broker.
After the month of lessons, you have three more months of personal chat support with Igor to discuss the material and its application.
Entirely one-to-one
Live teaching in your language.
Igor teaches in Russian. JotMe provides translated speech or high-quality live captions during your online meeting. You can ask questions and work through examples personally with him.
Translated voice
Hear translated speech during the same four live meetings of Investing Without the Rush.
$1,400
USD · Full course
Discuss by emailLive captions
Read Premium Quality captions as Igor speaks. Available for Investing Without the Rush, Trader and Light.
$1,100
USD · Full course
Discuss by emailTranslation is included. You do not need to buy a JotMe subscription or pay separately for it.
Before starting, agree your language and time zone by email. Receive links to the online meeting and JotMe translation, then check sound and connection together. Browser guests can open the translation link without installing JotMe. AI translation can need clarification: we can pause, repeat and explain terminology.
Entirely one-to-one
Learn to read the market.
A substantial private programme in market structure, price and volume. Connect observations, context and risk in a process you can explain, with assignments and close practical work.
A special focus on Larry Williams, W. D. Gann, Richard Wyckoff, Fibonacci and Tom DeMark. Also study COT reports, Point & Figure, Elliott waves, David Weis and risk management.
Entirely one-to-one
Trader · 10 months
Trader: ten months. Every month includes two four-hour live lessons and two two-hour practical sessions. That is 40 private meetings and 120 live teaching hours over the course.
$560
USD · per month
Full course: $5,600
Pay in full: $5,320 · 5% off full prepayment
Entirely one-to-one
Light · 20 months
Light: twenty months, with two one-hour live lessons and one one-hour practical session each month. Sixty private meetings and 60 live hours. Follow a more gradual thematic sequence with time to repeat examples, prepare assignments and return to difficult ideas.
$350
USD · per month
Full course: $7,000
Pay in full: $6,650 · 5% off full prepayment
Monthly payment on an agreed date. Payment details are arranged personally by email.
Translation is included. You do not need to buy a JotMe subscription or pay separately for it.
Your learning journey
Trader / Light
The sequence follows the school’s Russian-language curriculum, adapted for private international teaching. Trader covers two thematic units a month; Light spreads the twenty units across twenty months. Practice connects each topic with your own observations.
How prices move
Explore how supply, demand and liquidity shape price movements. Separate an observed price change from an explanation that still needs testing.
Independent practice: Mark three contrasting price movements and describe their market context.
Wyckoff: reading the tape I
Learn to read the sequence of price and volume changes. Relate each observation to its location within the wider market structure.
Independent practice: Annotate a short price sequence and explain the evidence behind your reading.
COT reports I
Read Commitments of Traders reports, which describe groups of futures-market participants. Distinguish reported positioning from a direct instruction to buy or sell.
Independent practice: Find a report and identify its participant groups and reporting date.
Wyckoff: reading the tape II
Compare advances, pullbacks and the volume accompanying them. Develop alternative explanations instead of assigning a fixed meaning to one bar.
Independent practice: Compare two pullbacks and list the evidence supporting each interpretation.
COT reports II
Track changes in participant positioning across several reporting periods. Consider the reporting delay and the difference between a futures contract and the asset you study.
Independent practice: Build a short positioning timeline and note its limitations.
DeMark methods I
Study the logic of DeMark trend and exhaustion tools. Check the conditions behind a signal before applying it to a chart.
Independent practice: Locate a candidate setup and document whether its conditions are met.
Wyckoff: accumulation and distribution
Study how trading ranges can develop into accumulation or distribution. Compare price behaviour at range boundaries with the broader context.
Independent practice: Annotate a range and write two competing explanations of its development.
DeMark methods II
Examine how DeMark conditions develop, fail or become invalid. Combine the tool with market structure rather than treating a count as certainty.
Independent practice: Review a completed and an invalidated setup using the same checklist.
COT: practical interpretation
Combine positioning observations with the price chart and relevant market context. Explain what the report supports and what it cannot establish.
Independent practice: Prepare a short market note with a COT observation and its limitations.
Bar-by-bar reading and order flow
Connect Wyckoff price-bar reading with cluster data inside a bar. Interpret Bid, Ask and delta as trading activity, not automatic directional forecasts.
Independent practice: Compare price, volume and delta on a selected market episode.
Point & Figure I
Learn how Point & Figure charts record price changes in boxes. Examine how box size and reversal settings affect the visible structure.
Independent practice: Build two versions of one chart and explain the structural differences.
Gann I and Fibonacci proportions
Explore Gann relationships between price and time alongside Fibonacci ratios. Treat these proportions as a framework for investigation rather than a guaranteed turning point.
Independent practice: Mark candidate relationships and state the assumptions used.
Point & Figure II
Use Point & Figure to compare ranges, breakouts and objectives. Distinguish a chart-based estimate from a result the market must deliver.
Independent practice: Analyse a range and record an objective together with its invalidation conditions.
Gann II and Fibonacci practice
Compare several price and time relationships within one scenario. Check whether the selected proportions remain meaningful when the reference points change.
Independent practice: Repeat an analysis with alternative reference points and compare the conclusions.
Larry Williams: stocks and seasonality
Study seasonal patterns in stocks using Larry Williams's approach. Separate a historical tendency from evidence supporting a current trade.
Independent practice: Compare a seasonal observation with the present price structure.
Risk I: position size
Calculate position size from the planned loss and the distance to invalidation. Include instrument specifications and trading costs in the calculation.
Independent practice: Calculate position sizes for two scenarios with the same loss limit.
Risk II: plan and discipline
Write entry, exit and review conditions before taking a position. Use a decision journal to distinguish a process error from an unfavourable outcome.
Independent practice: Create a trading checklist and review one past decision against it.
Elliott waves and Fibonacci confirmation
Identify candidate Elliott wave structures and their invalidation levels. Use Fibonacci relationships to compare alternatives rather than force a preferred count.
Independent practice: Present two wave counts and explain what would invalidate each one.
David Weis: volume, effort and result
Study how David Weis groups price movements and their volume. Compare trading effort with the distance price actually achieves.
Independent practice: Annotate an episode where rising effort produces a different price result.
Building a coherent strategy
Combine market context, selection rules, execution and risk into one repeatable process. Define how you will review decisions without assuming future profits.
Independent practice: Write a strategy draft and test its rules on historical examples.
How prices move
Explore how supply, demand and liquidity shape price movements. Separate an observed price change from an explanation that still needs testing.
Independent practice: Mark three contrasting price movements and describe their market context.
Wyckoff: reading the tape I
Learn to read the sequence of price and volume changes. Relate each observation to its location within the wider market structure.
Independent practice: Annotate a short price sequence and explain the evidence behind your reading.
COT reports I
Read Commitments of Traders reports, which describe groups of futures-market participants. Distinguish reported positioning from a direct instruction to buy or sell.
Independent practice: Find a report and identify its participant groups and reporting date.
Wyckoff: reading the tape II
Compare advances, pullbacks and the volume accompanying them. Develop alternative explanations instead of assigning a fixed meaning to one bar.
Independent practice: Compare two pullbacks and list the evidence supporting each interpretation.
COT reports II
Track changes in participant positioning across several reporting periods. Consider the reporting delay and the difference between a futures contract and the asset you study.
Independent practice: Build a short positioning timeline and note its limitations.
DeMark methods I
Study the logic of DeMark trend and exhaustion tools. Check the conditions behind a signal before applying it to a chart.
Independent practice: Locate a candidate setup and document whether its conditions are met.
Wyckoff: accumulation and distribution
Study how trading ranges can develop into accumulation or distribution. Compare price behaviour at range boundaries with the broader context.
Independent practice: Annotate a range and write two competing explanations of its development.
DeMark methods II
Examine how DeMark conditions develop, fail or become invalid. Combine the tool with market structure rather than treating a count as certainty.
Independent practice: Review a completed and an invalidated setup using the same checklist.
COT: practical interpretation
Combine positioning observations with the price chart and relevant market context. Explain what the report supports and what it cannot establish.
Independent practice: Prepare a short market note with a COT observation and its limitations.
Bar-by-bar reading and order flow
Connect Wyckoff price-bar reading with cluster data inside a bar. Interpret Bid, Ask and delta as trading activity, not automatic directional forecasts.
Independent practice: Compare price, volume and delta on a selected market episode.
Point & Figure I
Learn how Point & Figure charts record price changes in boxes. Examine how box size and reversal settings affect the visible structure.
Independent practice: Build two versions of one chart and explain the structural differences.
Gann I and Fibonacci proportions
Explore Gann relationships between price and time alongside Fibonacci ratios. Treat these proportions as a framework for investigation rather than a guaranteed turning point.
Independent practice: Mark candidate relationships and state the assumptions used.
Point & Figure II
Use Point & Figure to compare ranges, breakouts and objectives. Distinguish a chart-based estimate from a result the market must deliver.
Independent practice: Analyse a range and record an objective together with its invalidation conditions.
Gann II and Fibonacci practice
Compare several price and time relationships within one scenario. Check whether the selected proportions remain meaningful when the reference points change.
Independent practice: Repeat an analysis with alternative reference points and compare the conclusions.
Larry Williams: stocks and seasonality
Study seasonal patterns in stocks using Larry Williams's approach. Separate a historical tendency from evidence supporting a current trade.
Independent practice: Compare a seasonal observation with the present price structure.
Risk I: position size
Calculate position size from the planned loss and the distance to invalidation. Include instrument specifications and trading costs in the calculation.
Independent practice: Calculate position sizes for two scenarios with the same loss limit.
Risk II: plan and discipline
Write entry, exit and review conditions before taking a position. Use a decision journal to distinguish a process error from an unfavourable outcome.
Independent practice: Create a trading checklist and review one past decision against it.
Elliott waves and Fibonacci confirmation
Identify candidate Elliott wave structures and their invalidation levels. Use Fibonacci relationships to compare alternatives rather than force a preferred count.
Independent practice: Present two wave counts and explain what would invalidate each one.
David Weis: volume, effort and result
Study how David Weis groups price movements and their volume. Compare trading effort with the distance price actually achieves.
Independent practice: Annotate an episode where rising effort produces a different price result.
Building a coherent strategy
Combine market context, selection rules, execution and risk into one repeatable process. Define how you will review decisions without assuming future profits.
Independent practice: Write a strategy draft and test its rules on historical examples.
Included in your course
The lesson stays with you.
Receive the lesson recording and PDF notes after each lesson, so you can review the explanation and return to the key ideas.

Your personal chat
Your own chat with Igor: write in your language, share an assignment or ask a question. Translation of correspondence is arranged by the teacher.
24/7 manager support
A support manager is available in the chat 24/7 for connection, access and organisational questions. Educational questions and feedback are handled personally by Igor.
Experience behind the teaching.
I founded Student Wyckoff to share a structured approach to financial markets. My work combines research, investment strategies, analytical platforms, books and more than 1,000 teaching hours. My own market practice dates from 2005; work with private investors began in 2012.
In investment funds I analysed companies and financial statements, developed strategies, selected instruments, built and monitored portfolios, and managed risk. The funds involved investors from Russia, Canada and Germany.
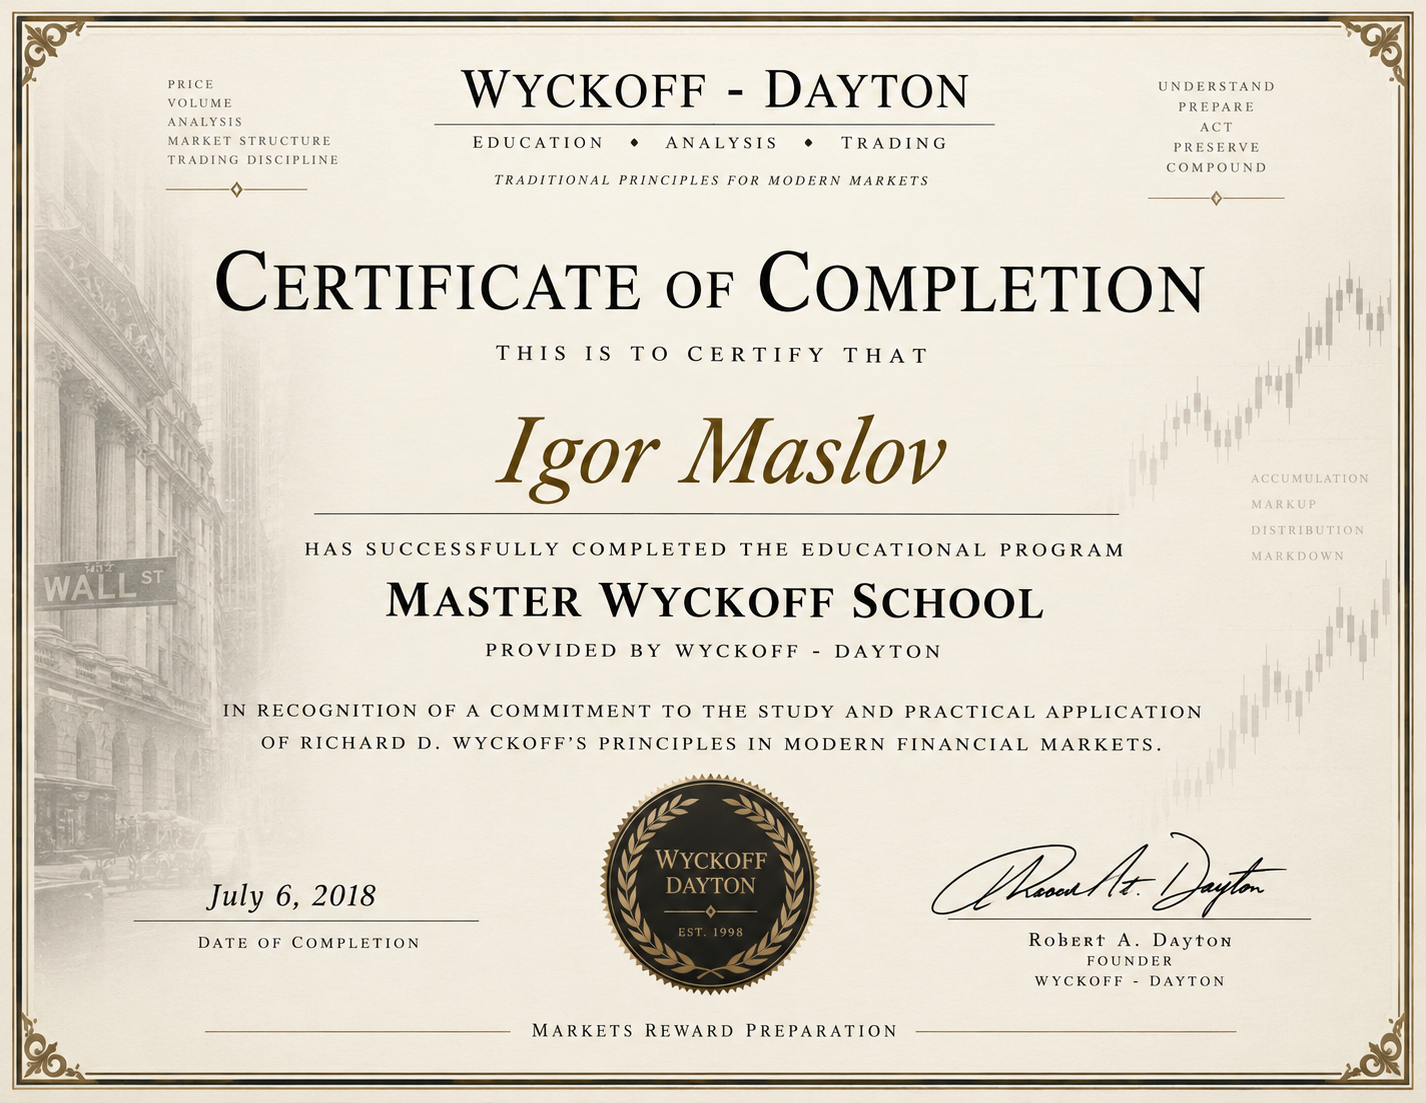 CertificateMaster Wyckoff School · 2018
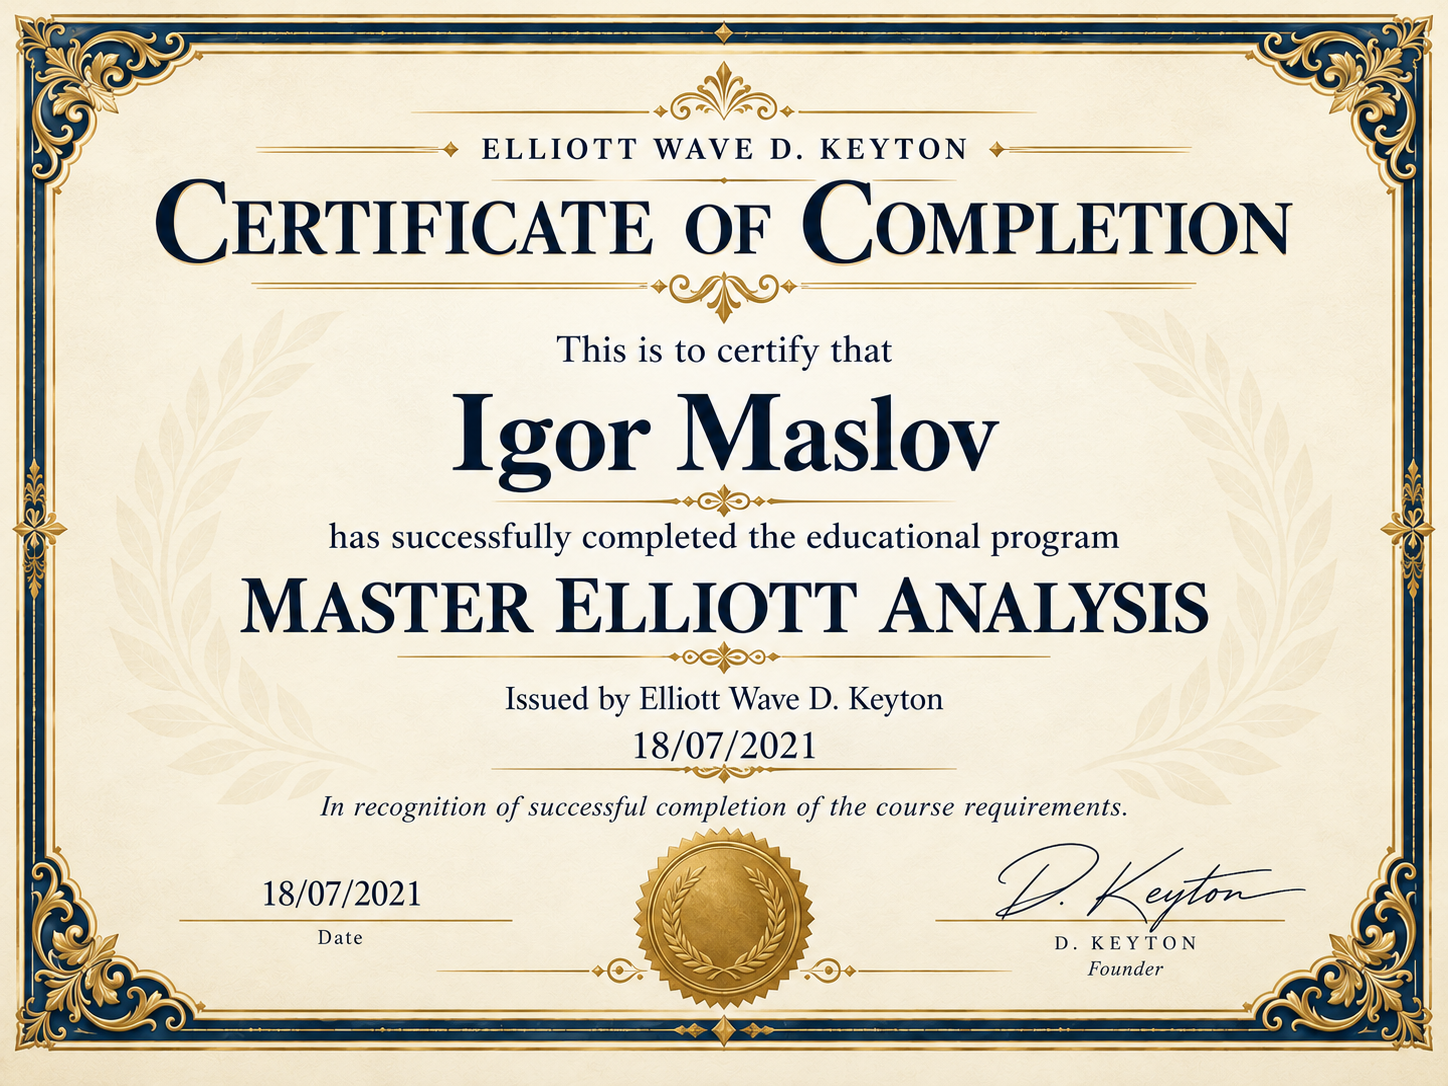 CertificateMaster Elliott Analysis · 2021
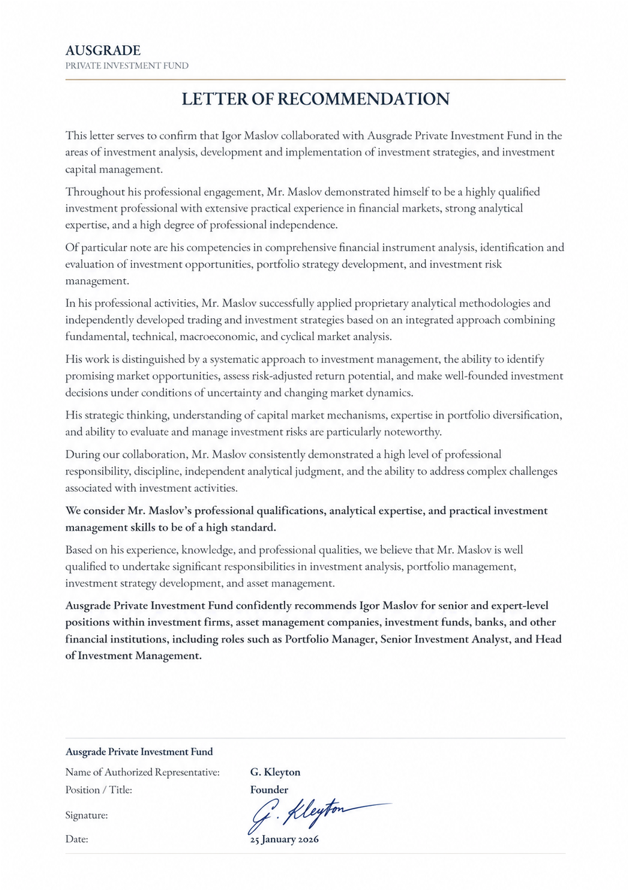 Recommendation letterAusgrade Private Investment Fund
Master Wyckoff School · 2018; Master Elliott Analysis · 2021; Ausgrade recommendation letter.
My projects
Explore my other work.
Student Wyckoff
Elliott Wave Light
Student Wyckoff Elliott Wave Light helps you investigate wave structure, compare possible counts and inspect nested wave degrees. A count is an analytical hypothesis to check against your data.
Light uses a browser workspace and a required Windows module. Platform access is a separate product, outside the course price. Its available interface languages may differ from the course languages.
My Day
My Day is my application for planning daily life, organising projects and learning, and keeping track of what matters to you.
YouTube
Get to know my approach and work on the Student Wyckoff YouTube channel. The channel includes Russian-language content.
Is all teaching private?
Yes. Every main lesson, practical session and homework review is one-to-one with Igor. These international programmes have no group classes.
How do I pay?
Trader and Light are paid monthly on an agreed date. If you pay the entire long course upfront, receive a 5% discount. Agree enrolment and payment details personally by email.
Does education guarantee investment returns?
No. Education develops understanding and a decision process. Markets involve risk, and investment decisions remain yours.
Get in touch
Let’s start with a conversation.
Email Igor before enrolling. Discuss your goals, experience, language, programme, schedule and translation option. Participation and payment arrangements are agreed personally.
studentwyckoff@gmail.com
Please include your name, preferred language, time zone and programme of interest.
Discuss by email